Tutorials
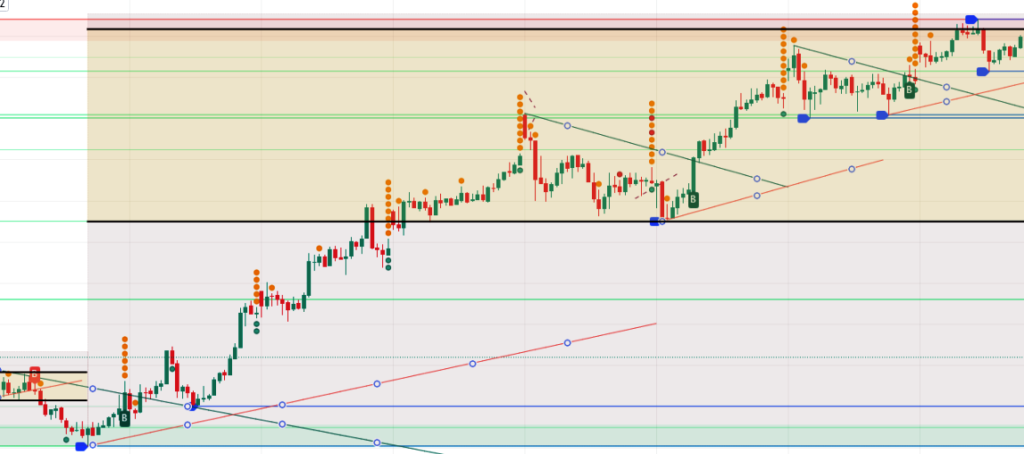
The yellow box is known as the value area.
The black lines represent the value line.
The grey area above and below the yellow box is referred to as the profile area.
Within the settings, you can toggle the horizontal volume bar, customize area colors, and adjust settings.
It’s important to note that the height of the value area adjusts dynamically based on factors like volume, price movement, footprints, volatility, and specific technical indicators.
Identifying Confirmed Breakouts, Potential Breakouts, and Unconfirmed Breakouts
Confirmed Breakouts: When a stock has taken a breakout in the 3-minute and 5-minute charts and is on the verge of breaking out in the 15-minute chart, with the trend line aligning closely for a breakout in the 30-minute chart, while displaying small to medium-sized candles. In the 5-minute chart, observe a series of candles breaking out step by step. If all the mentioned criteria match, it qualifies as a Confirmed Breakout.
Potential Breakouts: A stock that has broken out in the 1-minute, 3-minute, and 5-minute charts, but shows a distant trend line in the 15-minute chart. However, multiple breakouts have occurred in the 1-minute or 3-minute charts, indicating a Potential Breakout.
Unconfirmed Breakouts: In 5 minutes chart, if a single large candle breaks out across all time frames simultaneously – 1, 3, 5, 15, 30 minutes – with a significant gap up or gap down open, it signifies an Unconfirmed Breakout.
Note: Before engaging in a trade, assess the preceding and subsequent minute charts to ensure alignment of trend lines for potential breakouts in the upcoming time frames.
Make sure: Switching between various time frames and analyze charts for 3 minutes, 5 minutes, and 15 minutes. Examining multiple time frames provides a clearer market trend perspective.
Remember: It is vital to wait for confirmation before entering a trade. Trading successfully requires patience, discipline, and adherence to risk management principles. By following these guidelines diligently and staying alert, you can improve your ability to identify and profit from confirmed breakouts while steering clear of unconfirmed ones. Prioritize risk management and adhere to your trading strategy for consistent and profitable results.
Chart view with Seven Technical Indicators namely
- Intraday Indicator
- Algo Price Action Indicator
- Magic Support & Resistance Indicator
- Centre Pivot Range Indicator
- Magic SR Block Detector Indicator
- FVG Imbalance Tracing
- RSI Indicator