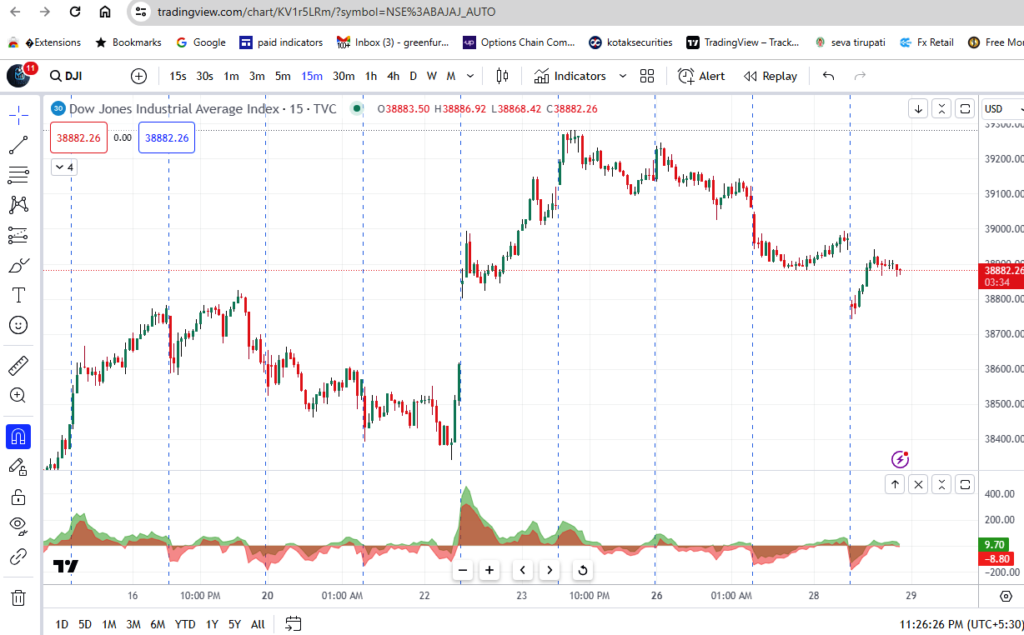
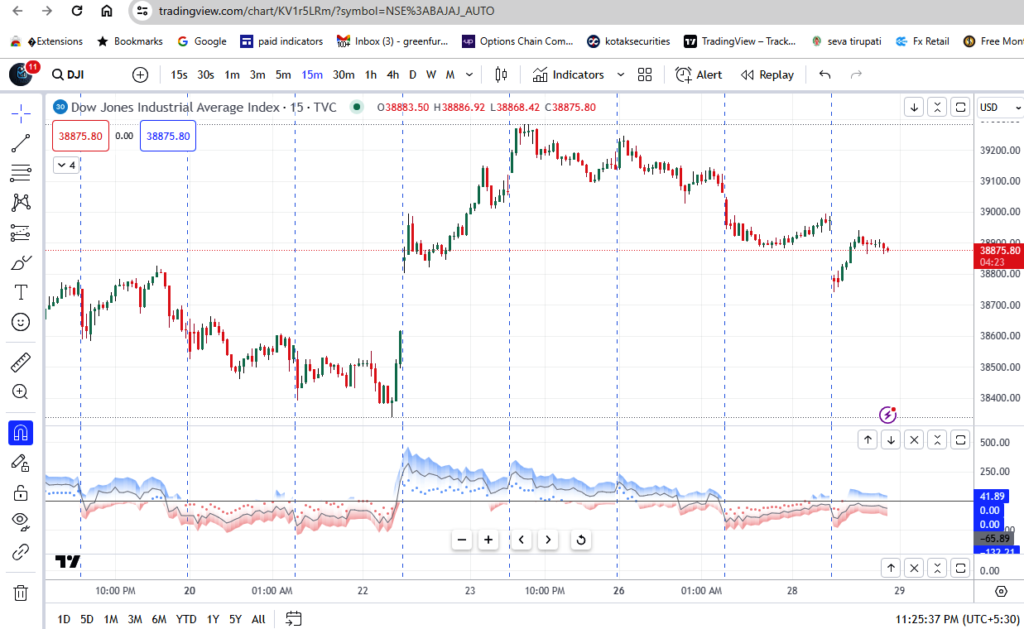
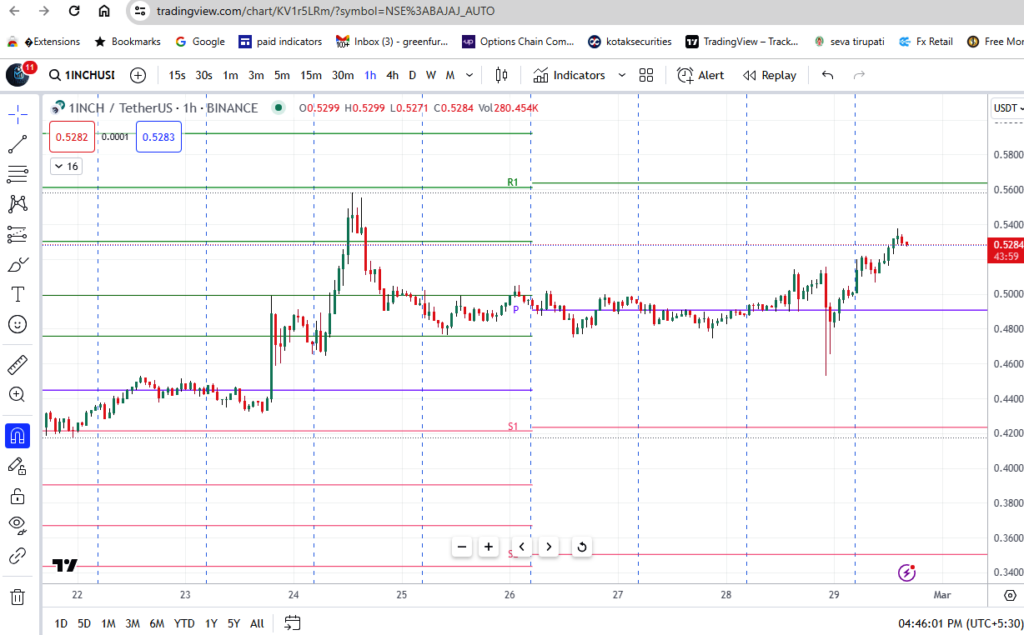
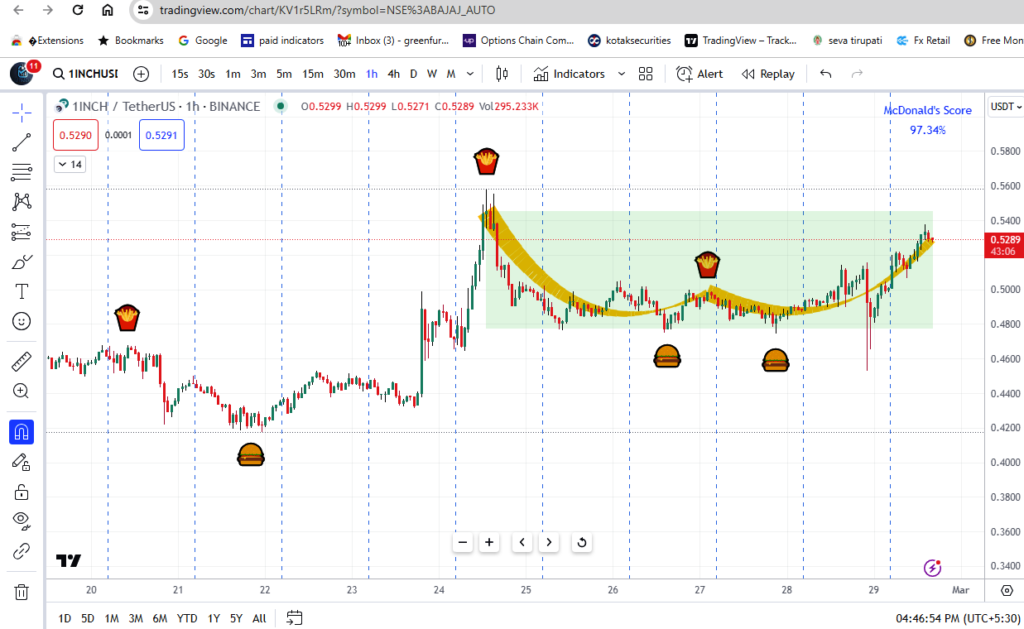
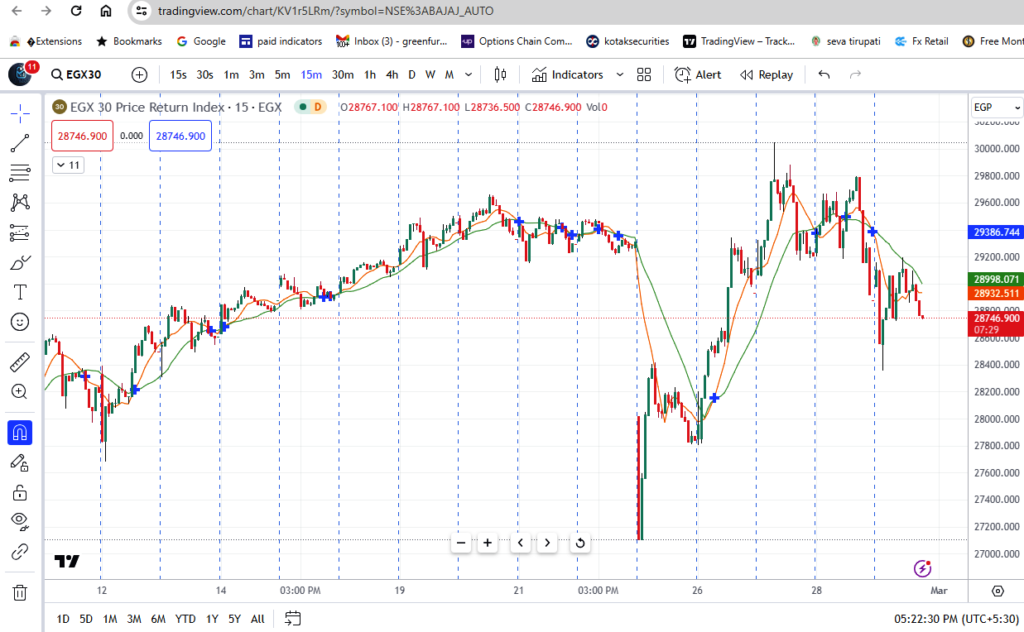
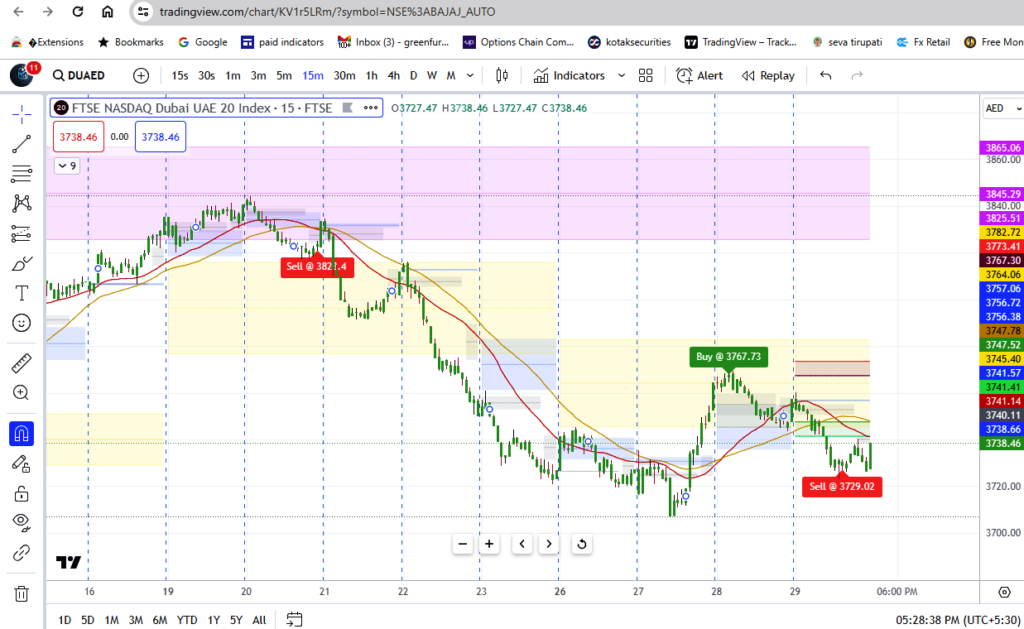
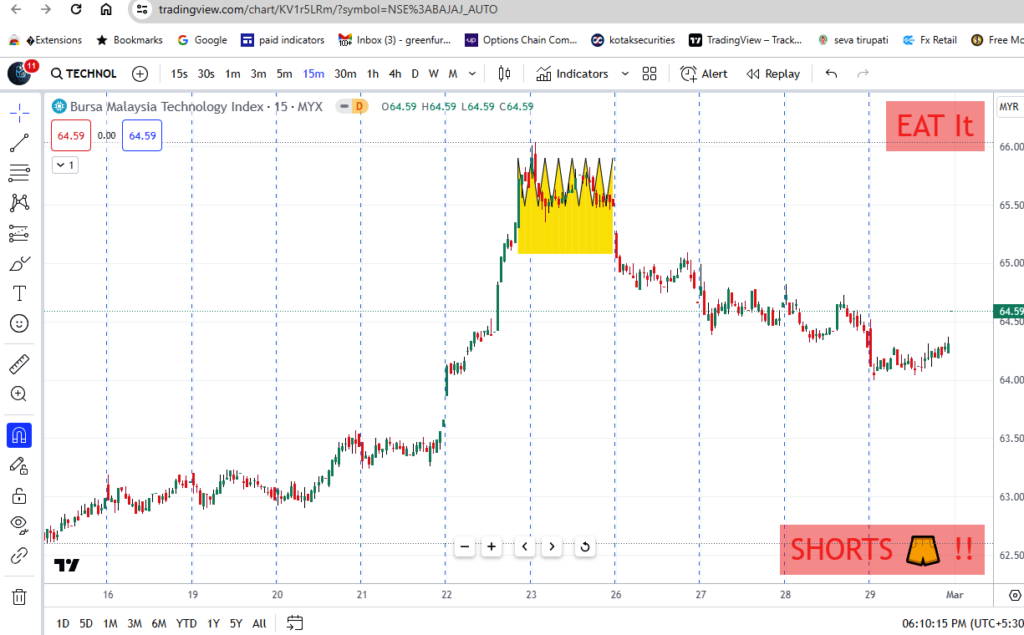
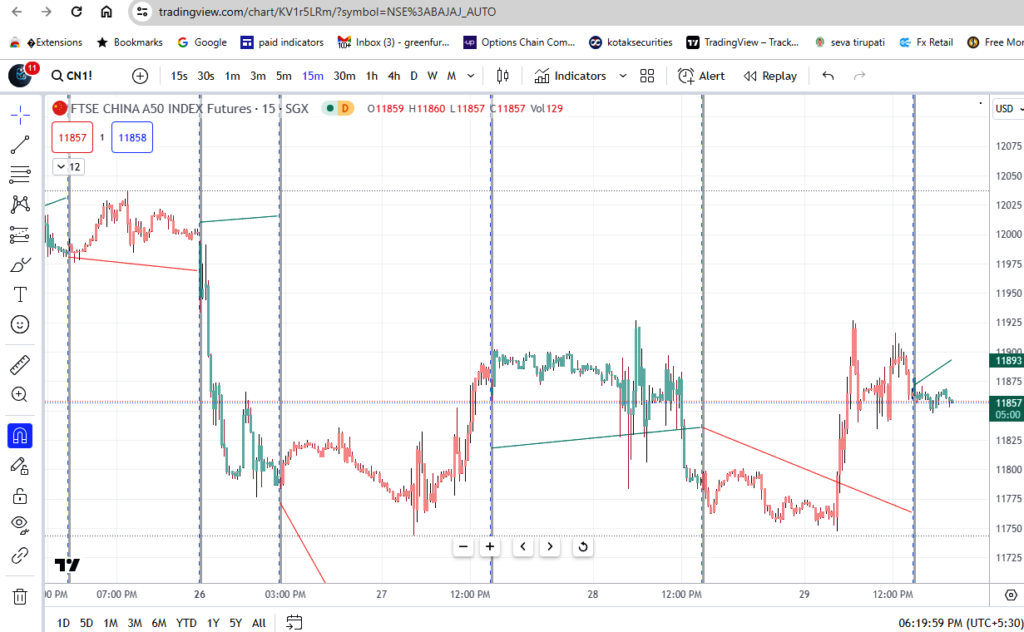
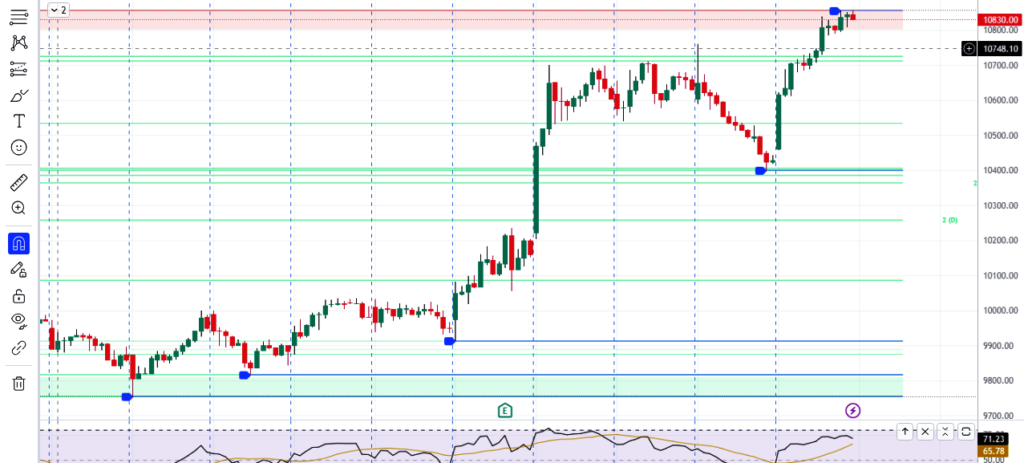
Intraday Indicator is also a Informed Decision Indicator. Indicates Trend Breakouts The yellow box is known as the value area. The black lines represent the value line. The grey area above and below the yellow box is referred to as the profile area. Within the settings, you can toggle the horizontal volume bar, customize area colors, and adjust settings. Note that the height of the value area adjusts dynamically based on factors like volume, price movement, volatility, and specific technical indicators.
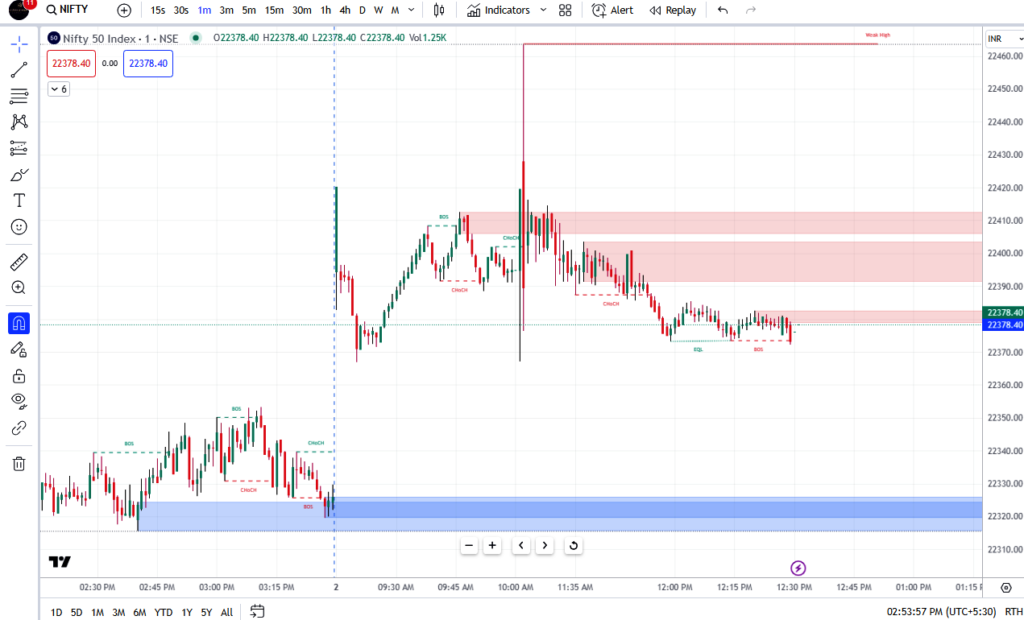
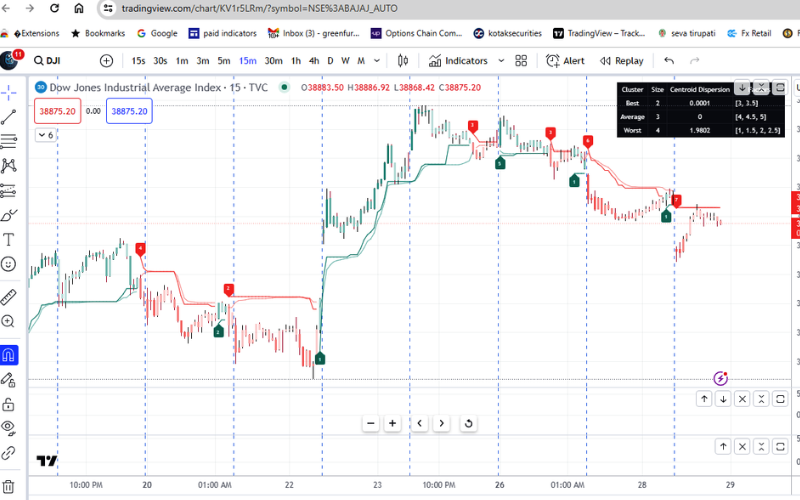
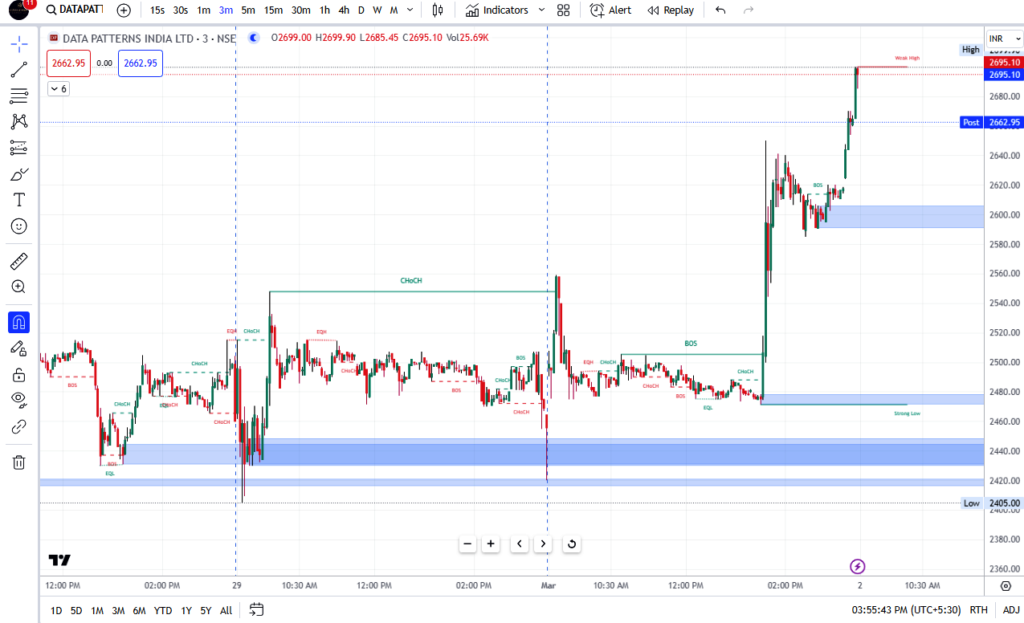
Algo Price Action
Algo Price Action indicates
BOS (Break of Structure)
CHOCH (Change of Characters)
Price action Internal Volume Blocks
FVG Fair Value Gaps
Swing Order Blocks
Equal, High, Low Levels
Premium/Discount Zones
more in settings
Within the settings, you can toggle
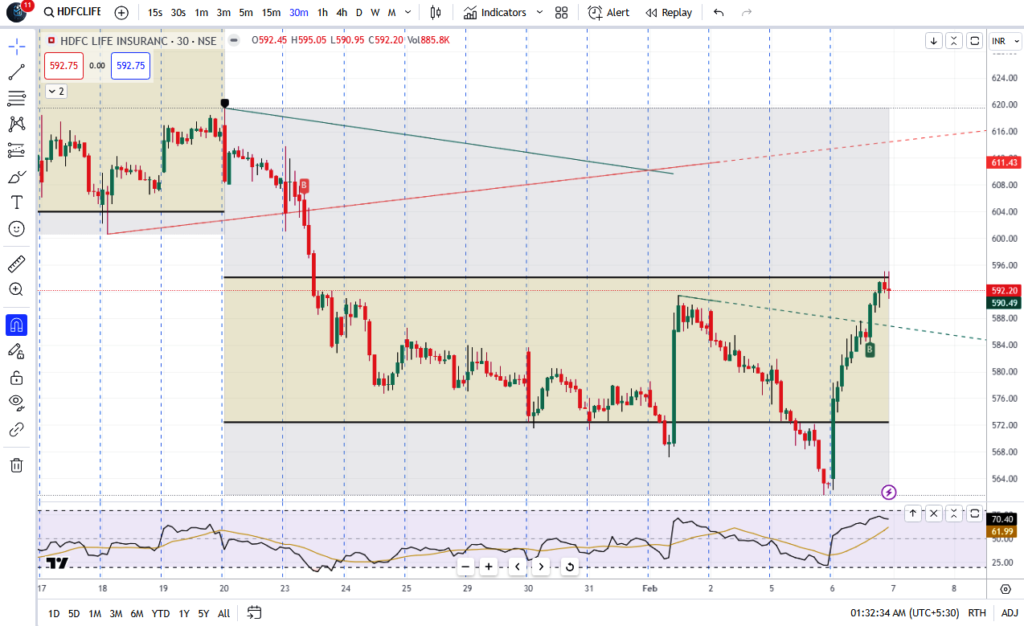
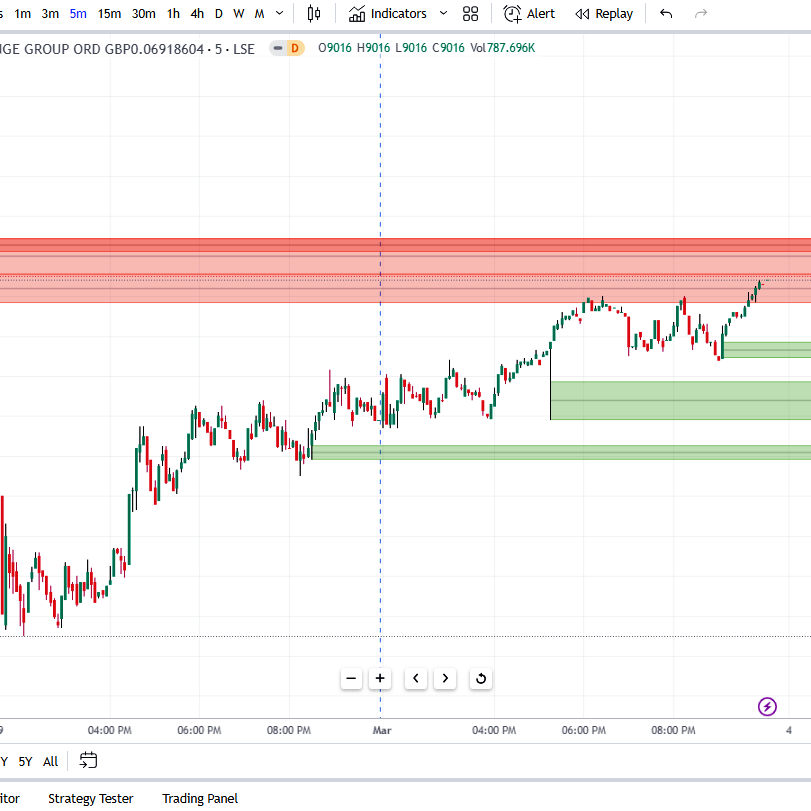
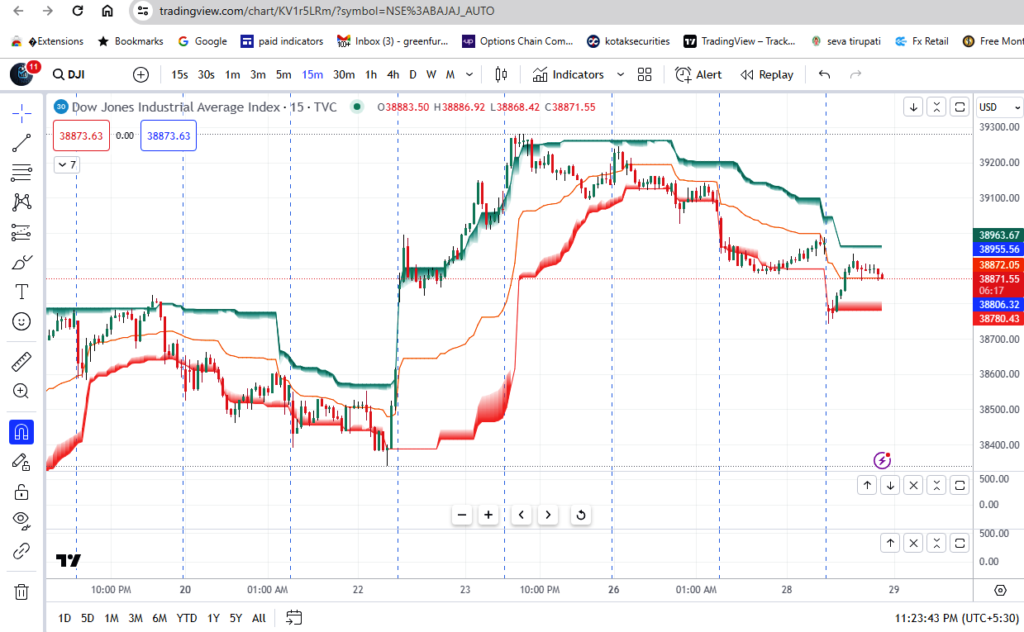
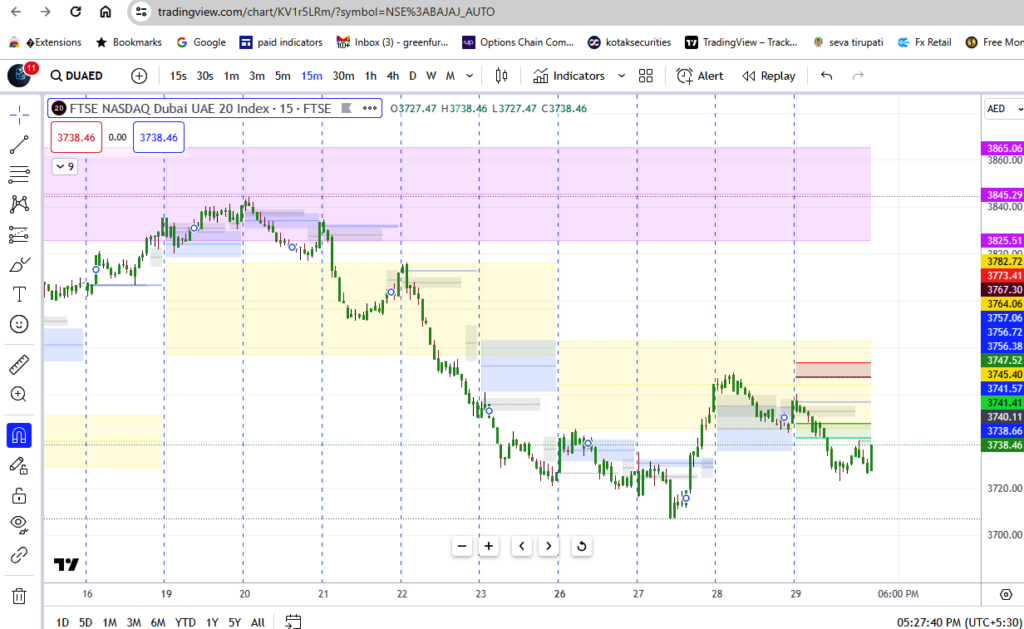
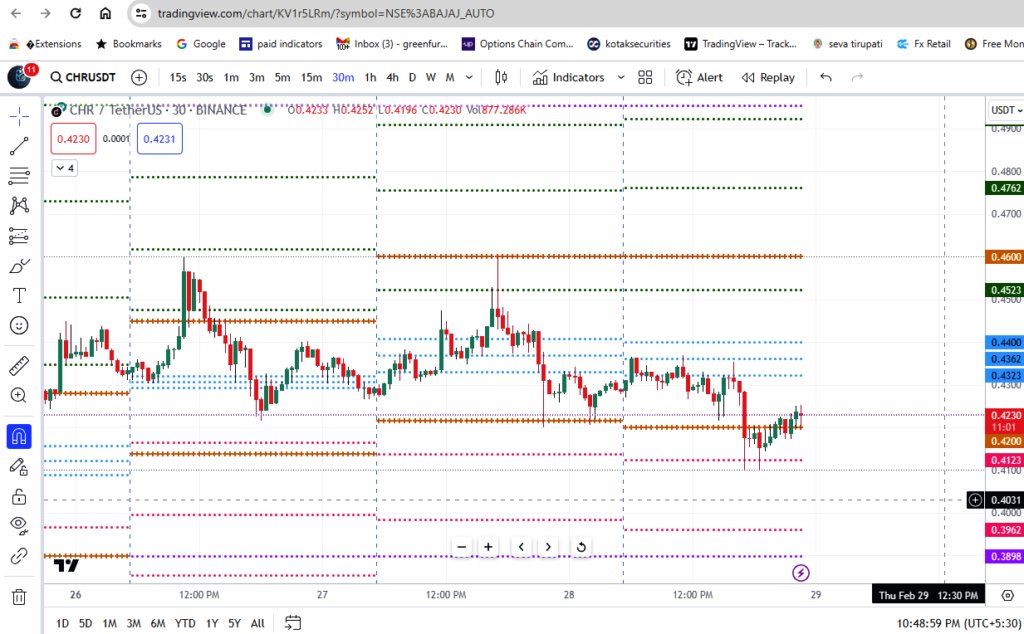
Magic SR Indicator
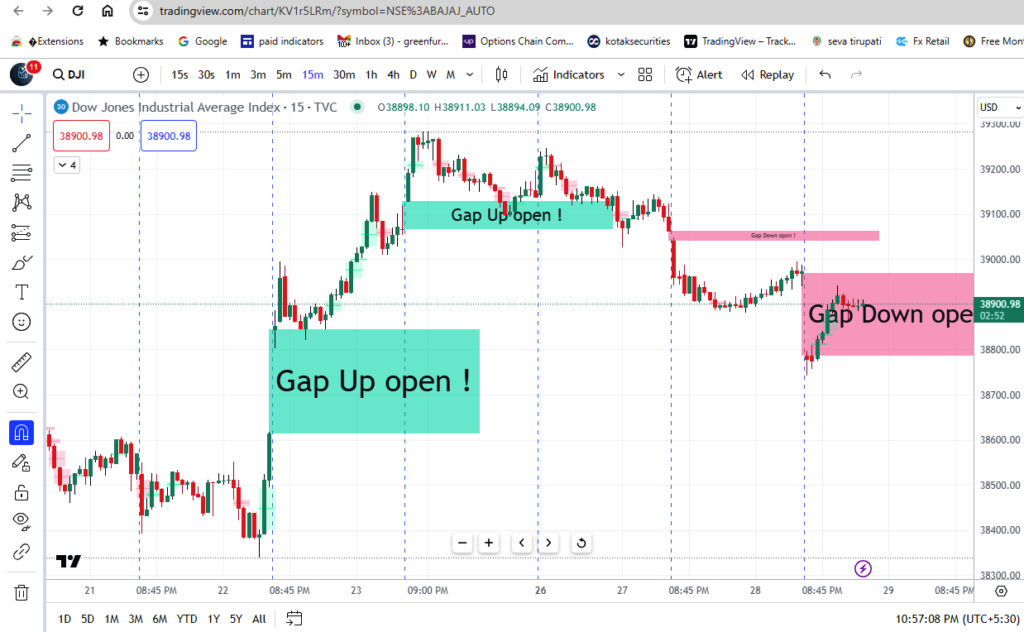
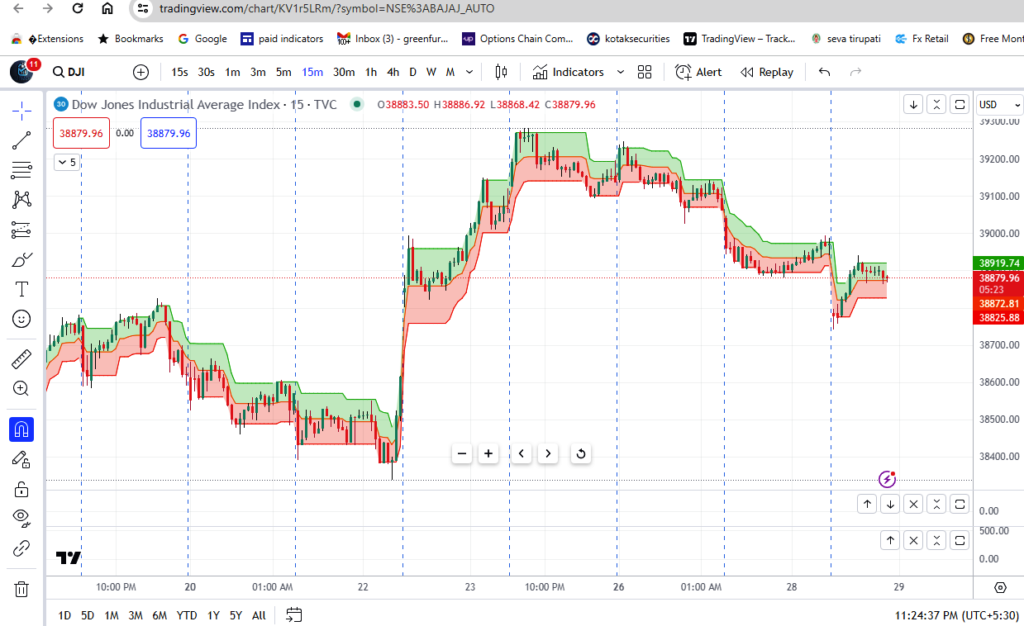
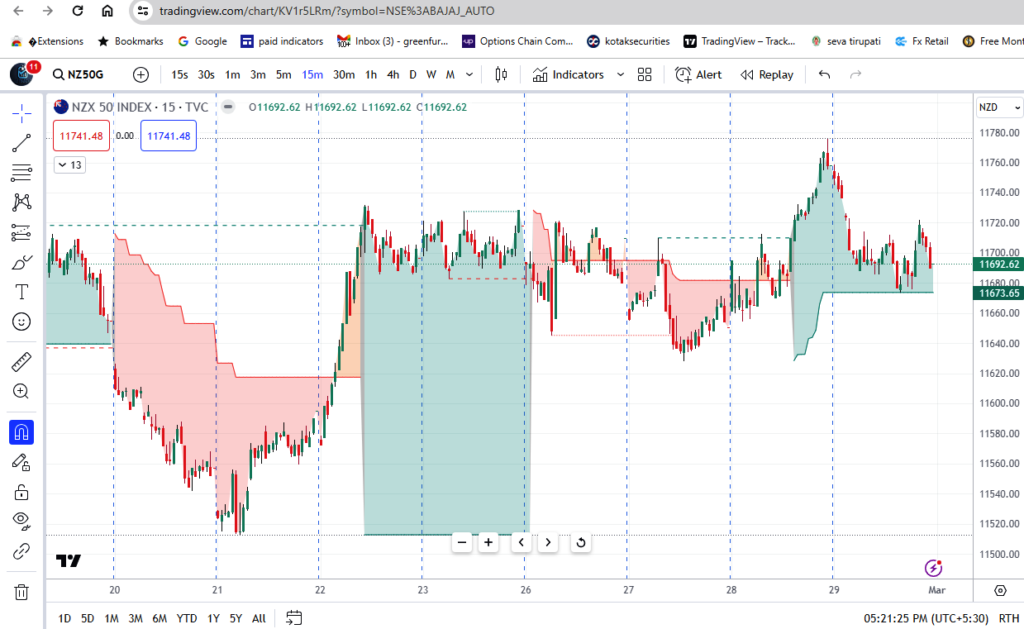
Magic Support andResistance Block Detector is also a Informed Decision Indicator, very Important role in Trading is identifying Reversal level, Target levels, Trend detecting with multiple conformations and Indicator is particularly helpful in identifying Bullish and BearishOrder blocks. Magic SR Block Detector Indicator users gain clarity on the market’s direction, whether it’s an uptrend or a downtrend Within the settings, you can toggle the horizontal volume bar, customize area colors, and adjust settings.
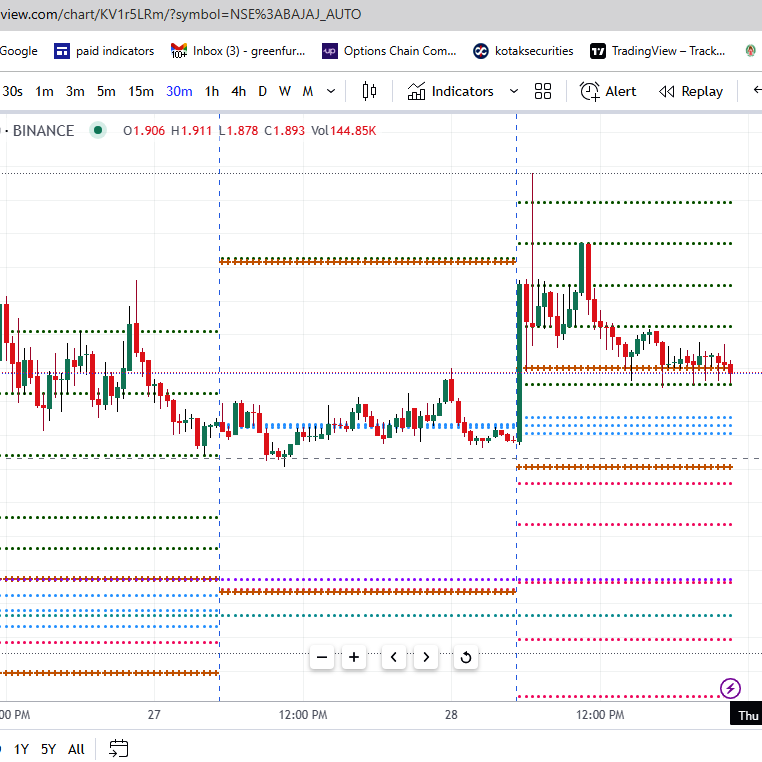
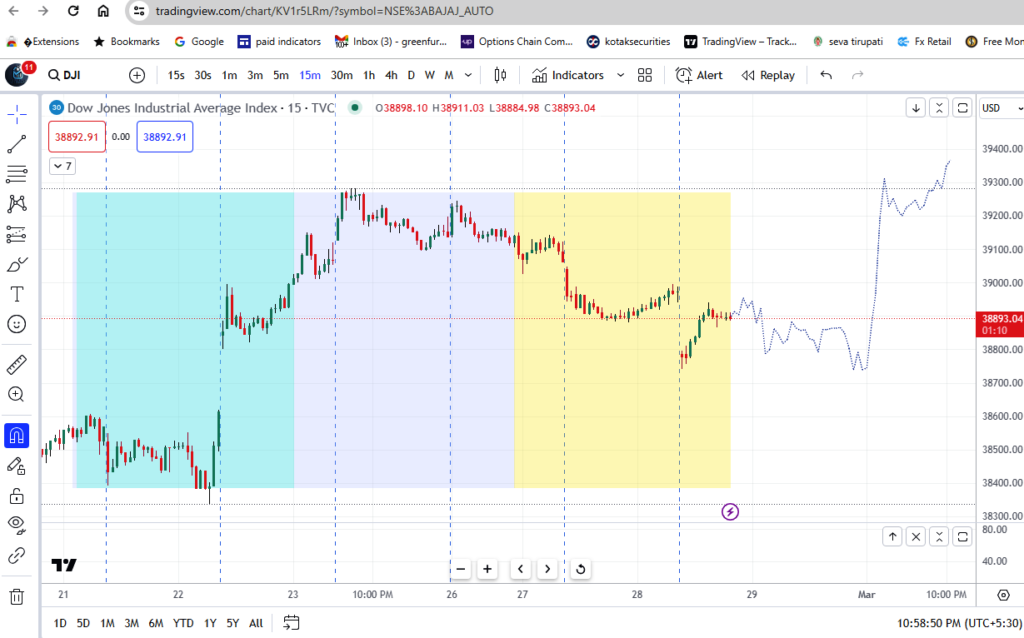
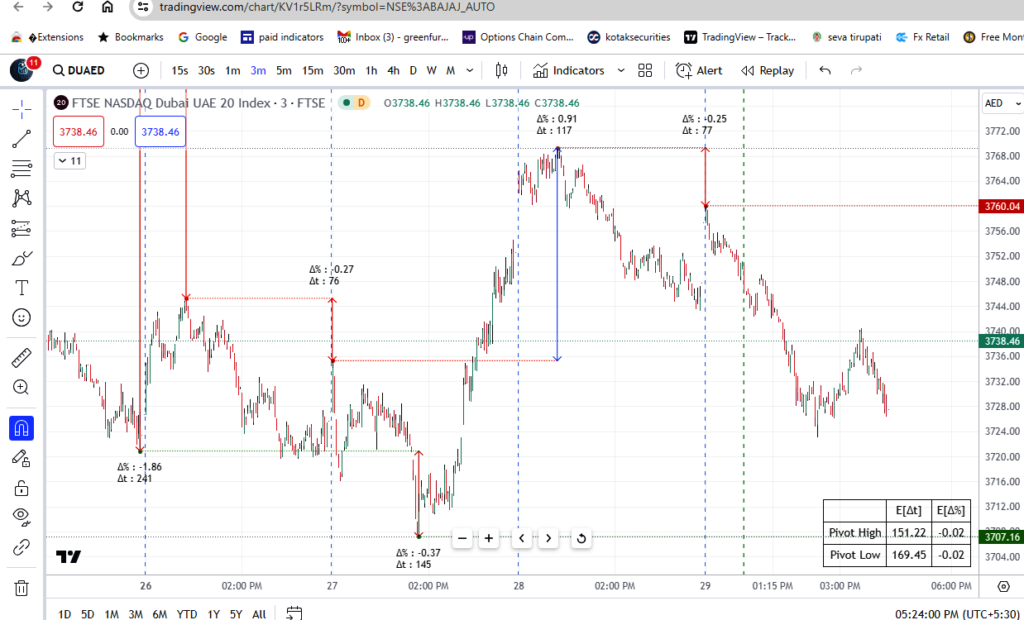
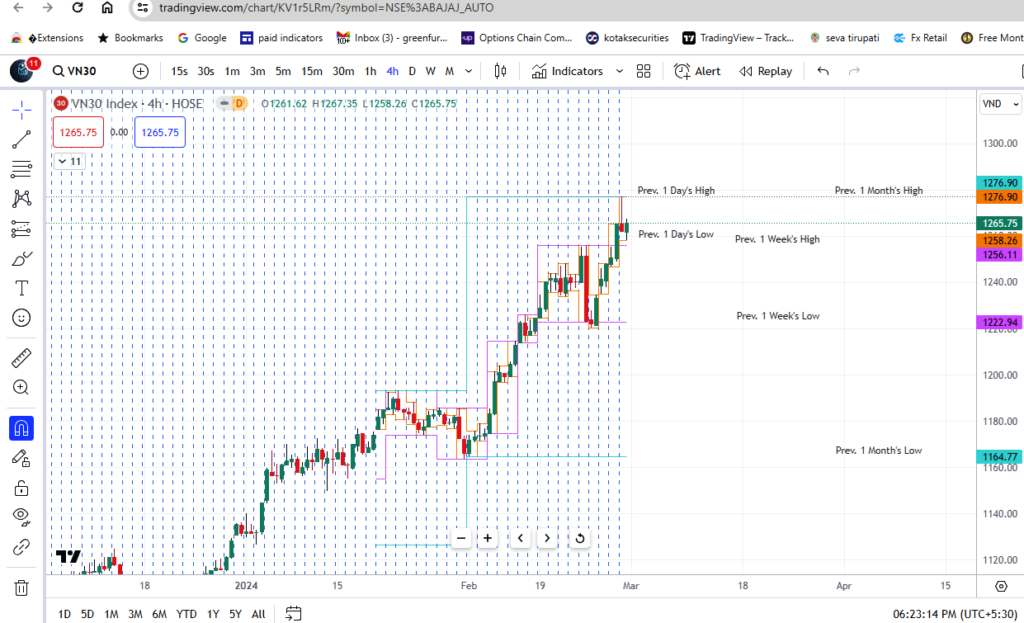
Centre Pivot Range Indicator
Centre Pivot Range: More detailed Indicator based on Pivot points, which has Three Pivots Upper pivot line, Bottom Pivots line and Centre Pivot line, also it has Previous Day High/Low lines, Previous Week High/Low, Previous Month High/Low, more detailed levels and its very much useful on Trading to Identify our Target Levels, all the lines are very neatly color coded, so its very easy to Understand at which level the Trade happening Pivot Lines are Light blue color Support Lines are red color Resistance lines are green color Previous Day High/Low lines are orange Color Previous Week Lines are Purple Color Previous Month High/Low Lines are cyan color
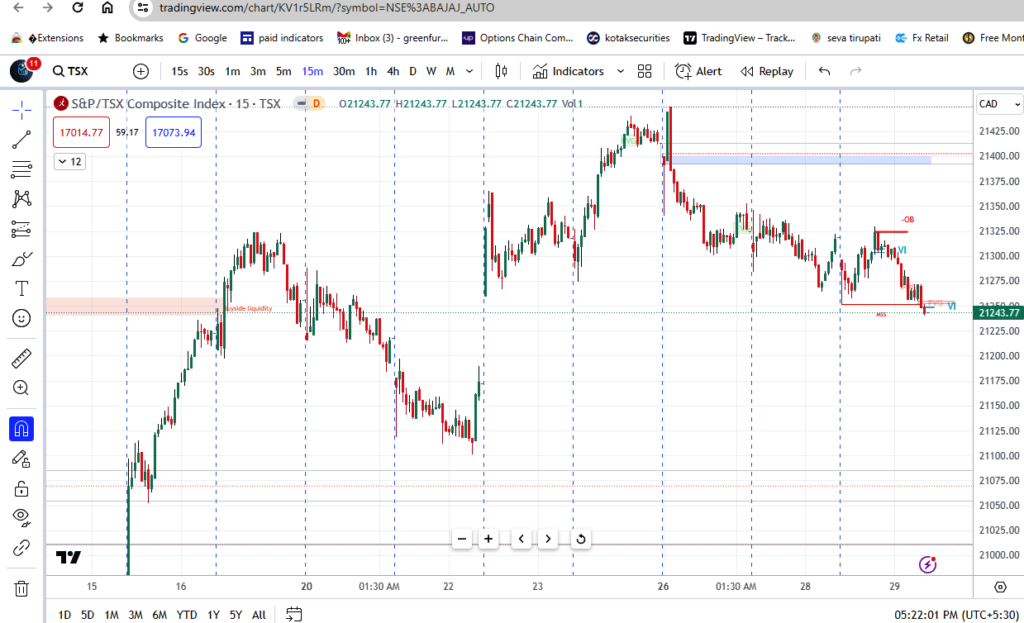
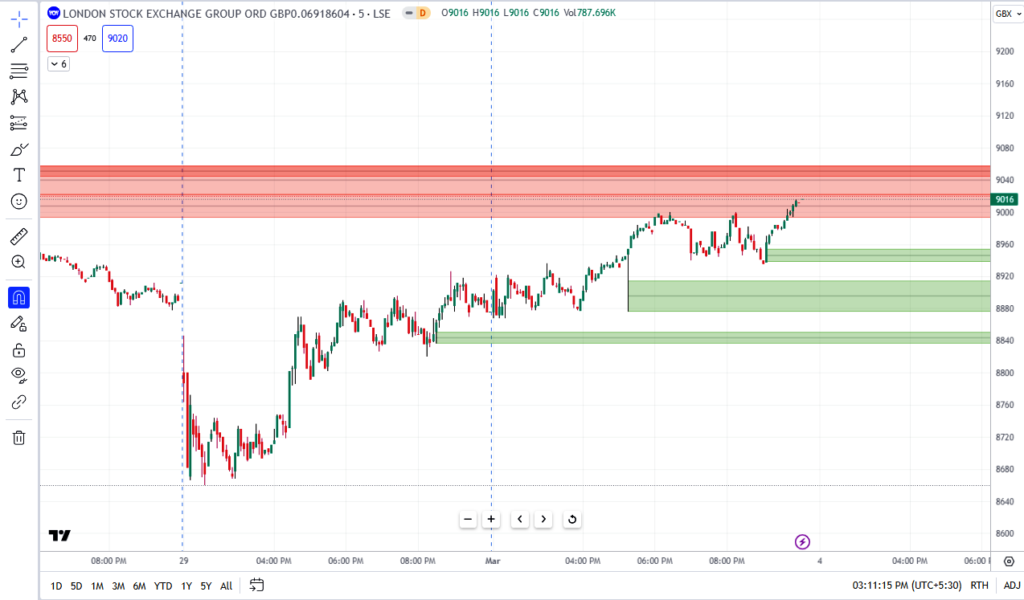
Magic SR Block Detector
Magic Support andResistance Block Detector is also a Informed Decision Indicator, very Important role in Trading is identifying Reversal level, Target levels, Trend detecting with multiple conformations and
Indicator is particularly helpful in identifying Bullish and BearishOrder blocks.
Magic SR Block Detector Indicator users gain clarity on the market’s direction, whether it’s an uptrend or a downtrend
Within the settings, you can toggle the horizontal volume bar, customize area colors, and adjust settings.
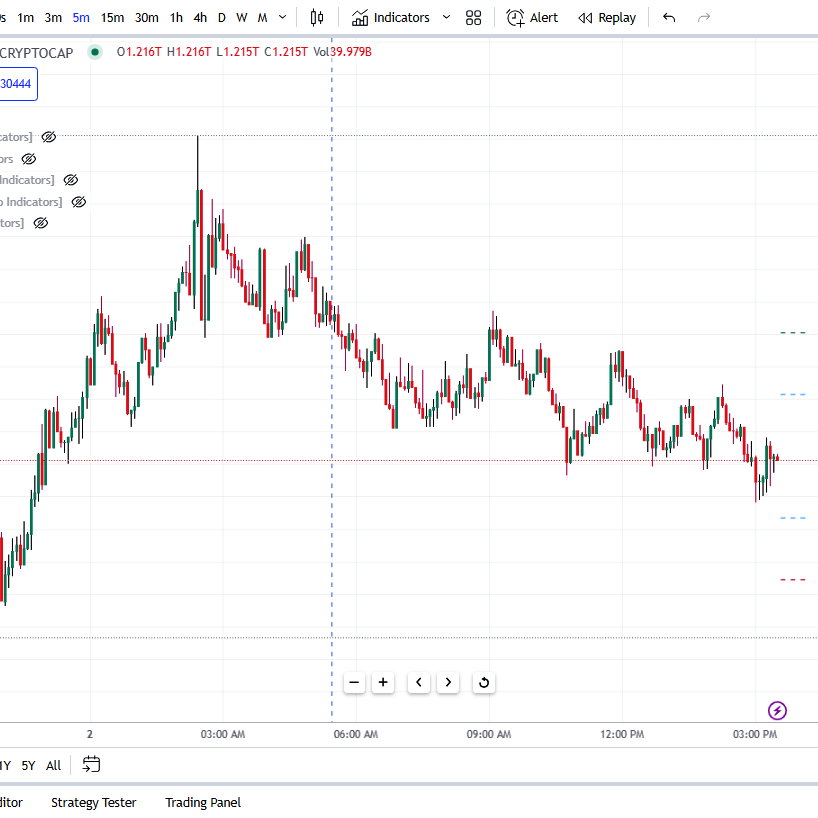
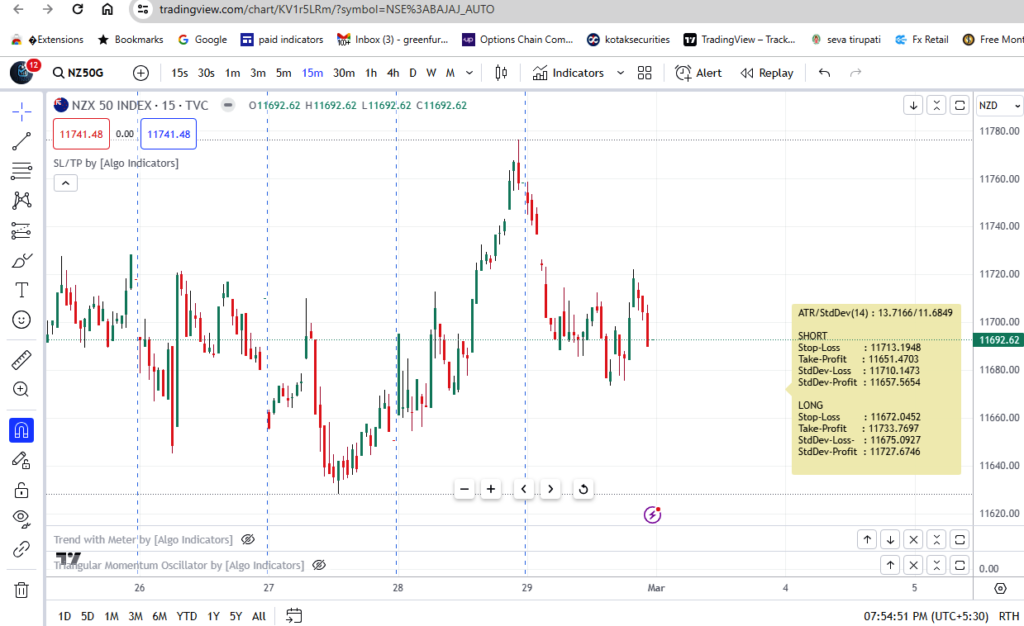
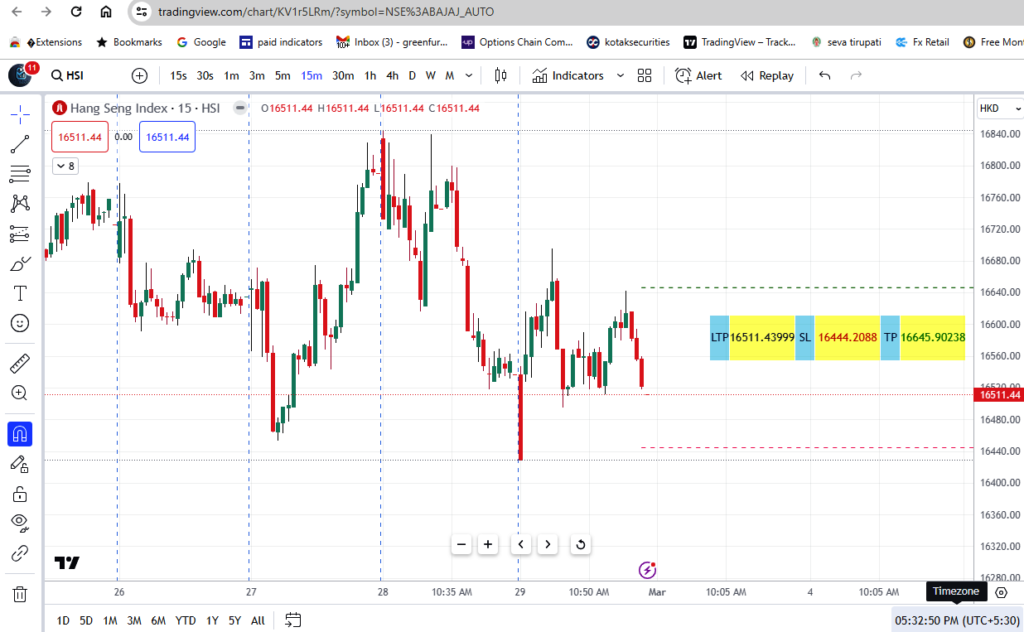
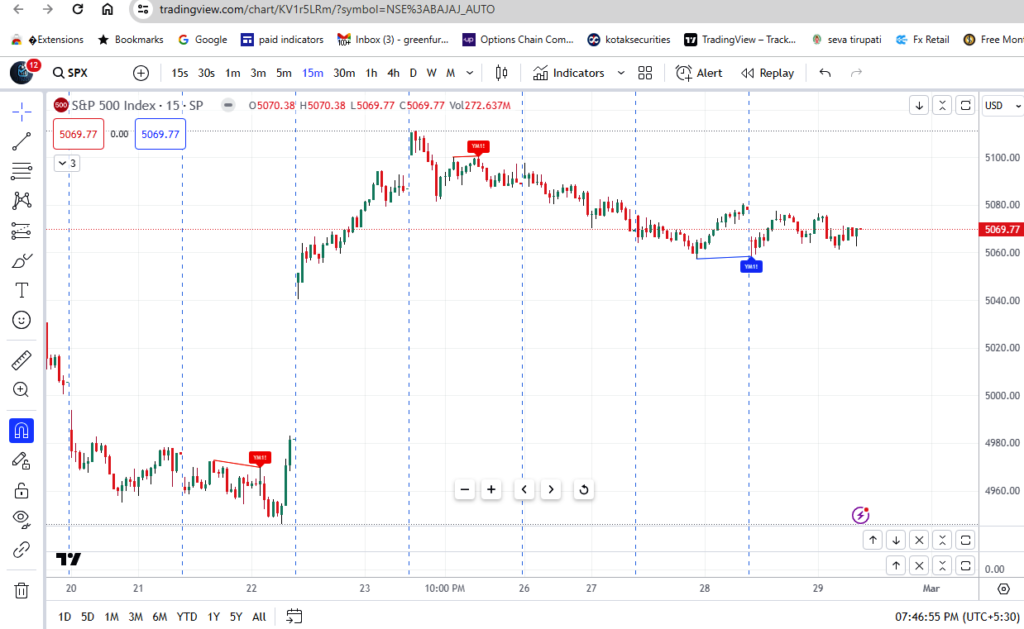
Take profit and Stop Loss
Take Profit and Stop Loss Indicator is particularly helpful in identifying Take Profit levels and stop loss levels Trailing Indicator shows up to three levels Levels shows Bands show Labels Within the settings, you can toggle
Deciphering the Complexity of
Intraday Market Analysis
Embark on a journey to unravel the intricacies of intraday market analysis, where every fluctuation holds significance. Gain a profound understanding of market dynamics, from price movements to volume distribution, as you navigate through the labyrinth of trading data. Explore advanced analytical tools and customizable features to refine your trading strategy and stay ahead in the fast-paced world of intraday trading.
Navigating the Intricacies of Intraday Market Analysis
Understand the significance of price movements and volume distribution
Navigate through the labyrinth of trading data
Utilize advanced analytical tools and customizable features
Refine your trading strategy to stay ahead in the fast-paced world of intraday trading
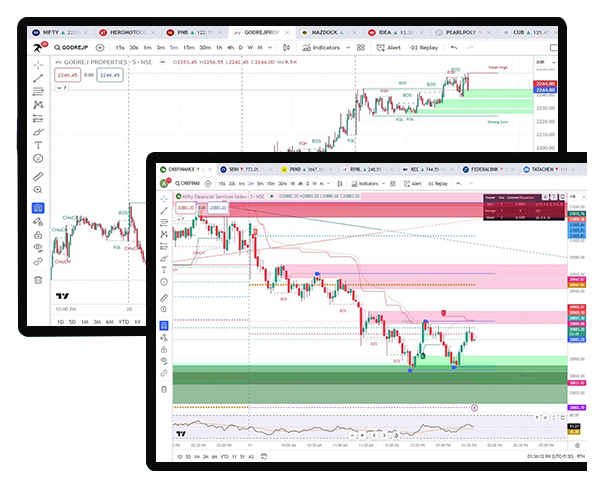
Identifying Confirmed Breakouts, Potential Breakouts, and Unconfirmed Breakouts
Confirmed Breakouts
Breakouts align on 3, 5, and 15-minute charts, indicating strong potential for price movement.
Potential Breakouts
Simultaneous breakouts on multiple time frames signal significant momentum and potential for substantial price movement.
Unconfirmed Breakouts
Breakouts lack alignment across time frames, suggesting caution due to potential false signals.
Trend Line Analysis
Analyze trend lines for breakout confirmation, crucial for identifying reliable trading opportunities.
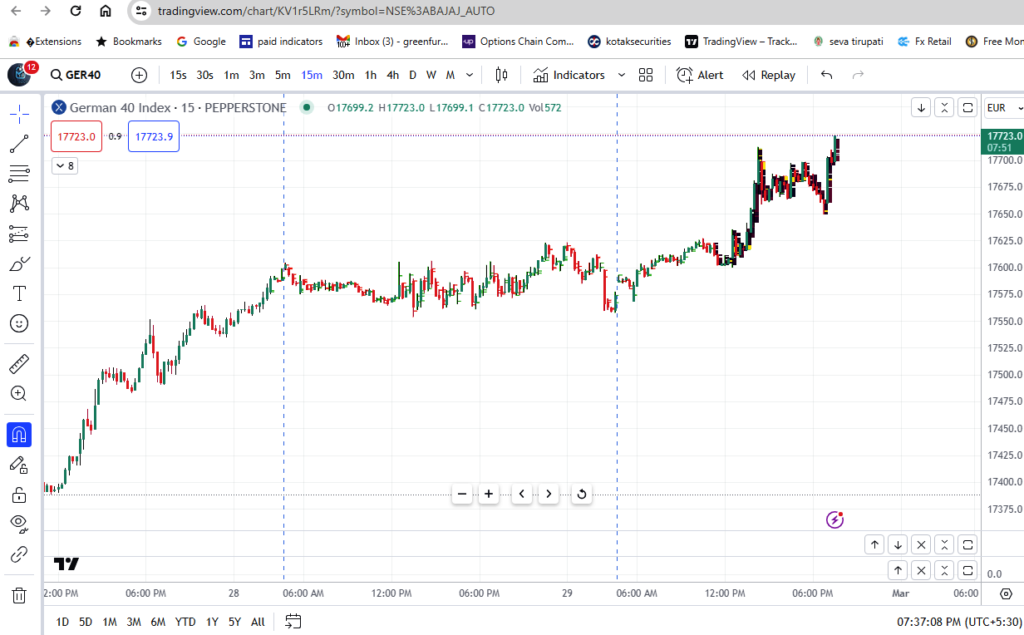
Multi-Time Frame Analysis
Assess charts across various intervals (3, 5, and 15 minutes) to validate breakout patterns and confirm market trends.
Patience & Discipline
Exercise patience and discipline, waiting for confirmation before entering trades to avoid unnecessary risks.
Risk Management
Prioritize effective risk management strategies to mitigate potential losses and protect capital.
Stick to Trading Plan
Adhere to a disciplined trading plan, ensuring consistency and adherence to predetermined strategies.
Consistent Profitability
Strive for consistent and profitable outcomes by following proven trading methodologies and maintaining a disciplined approach.
Mega Trend
FVG Imbalance Tracing
Echo Forcast
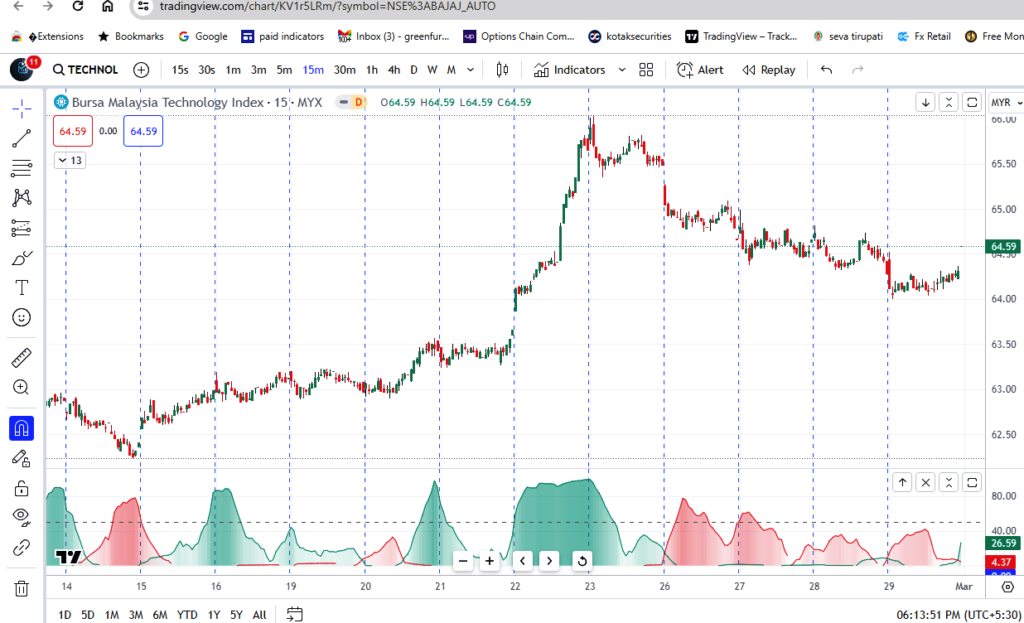
Bulls and Bears Oscillator
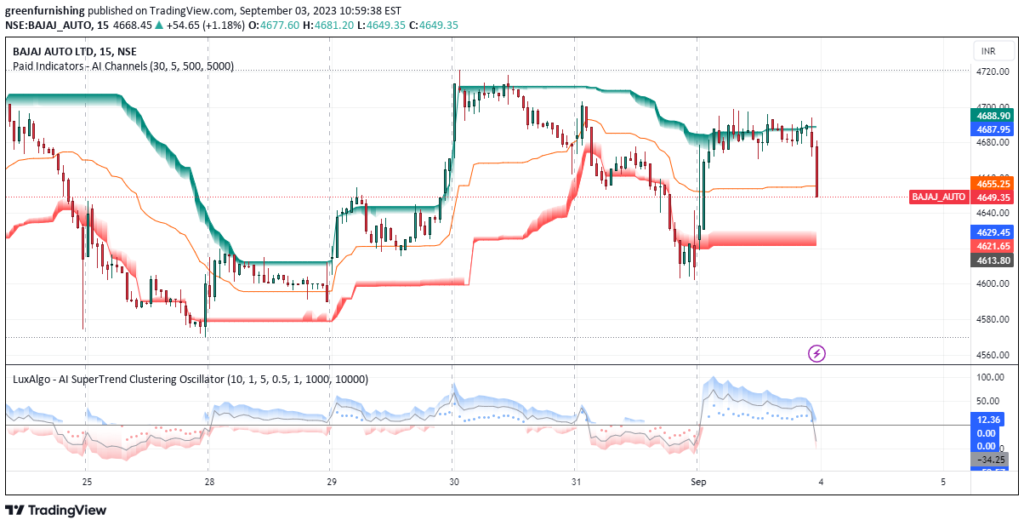
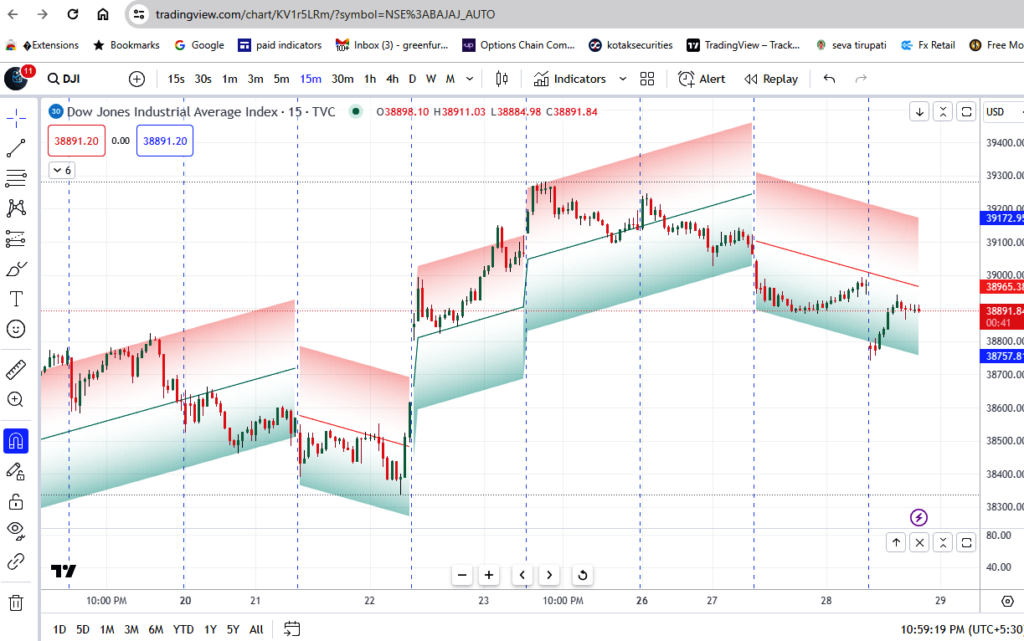
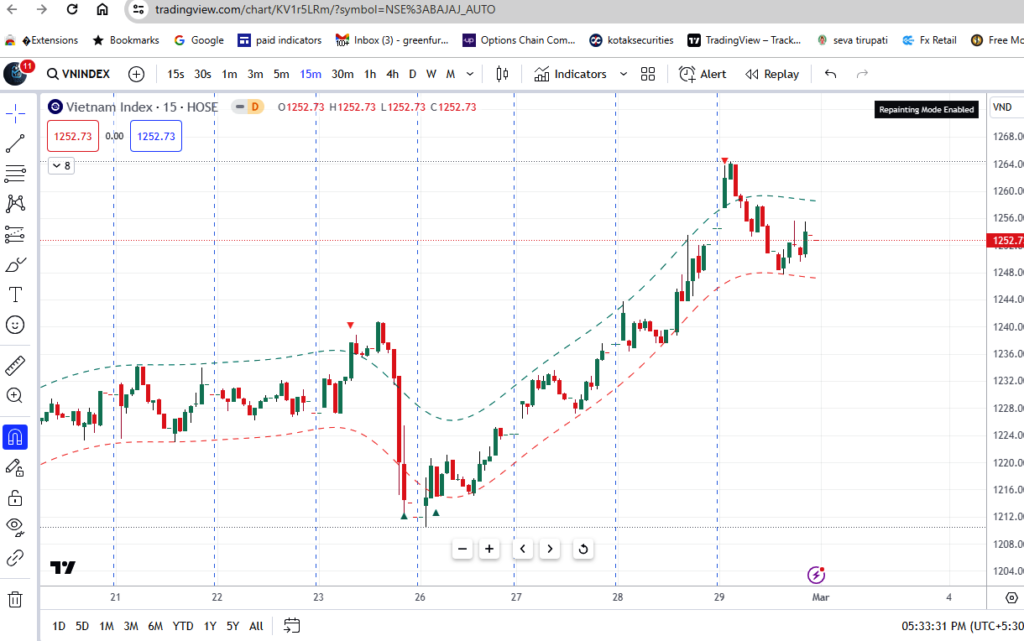
AI Channel
AI Cluster
Super trend Trailer
AI Super trend
TP/SL
Pivot Standard Point
MC Dowells
Market Structure
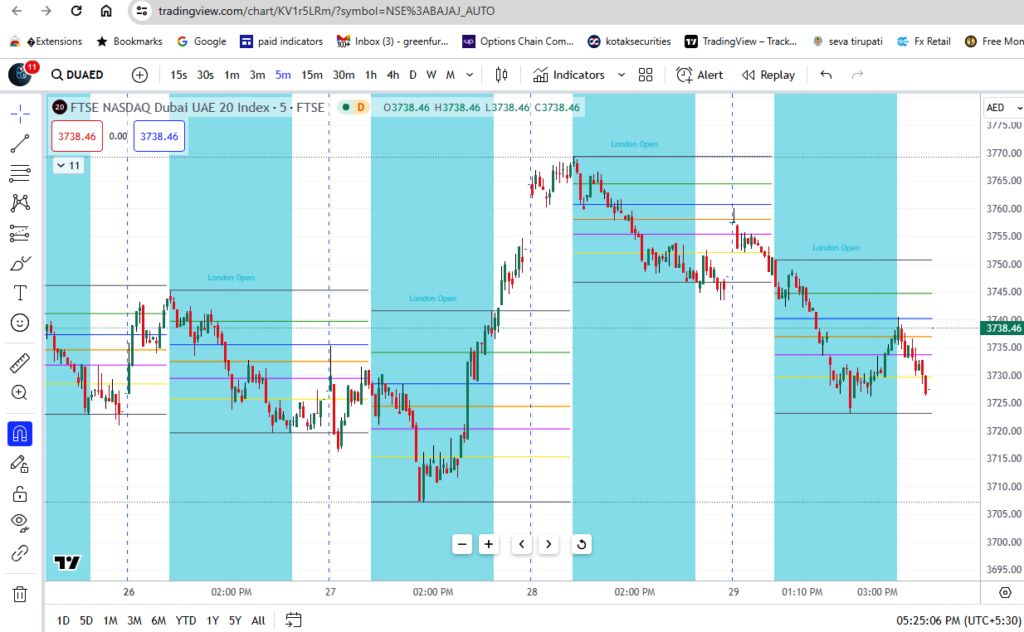
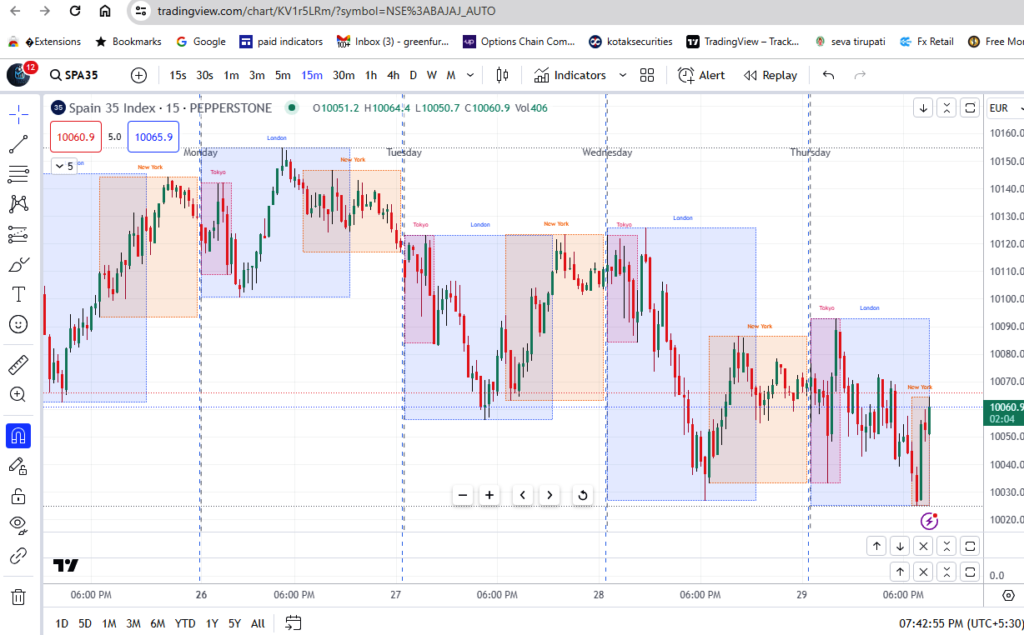
ICT Kill zone
MA Cross
Sessions
High Low Analysis
ICT Concept
Buy & Sell Indicator
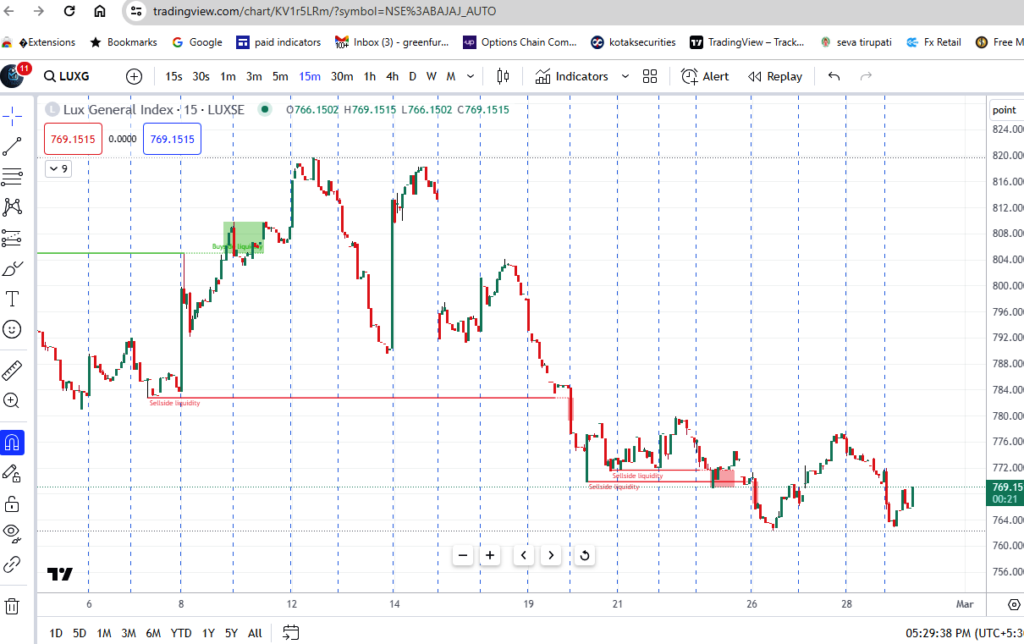
Buy Sell Liquidity
Envolop
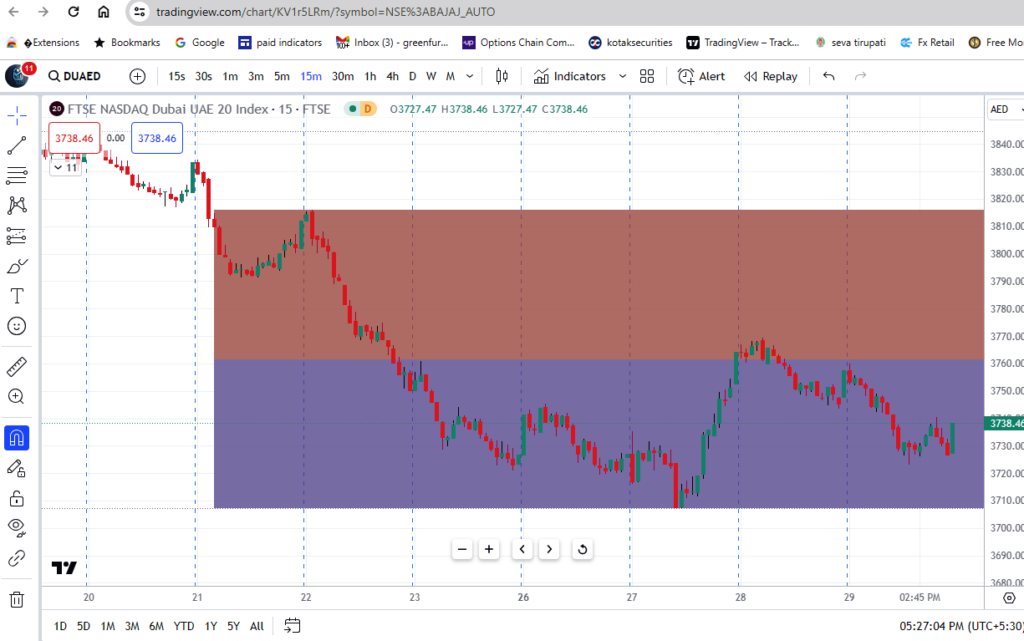
Demand & Supply
ATR Stop Loss
CPR+VWAP
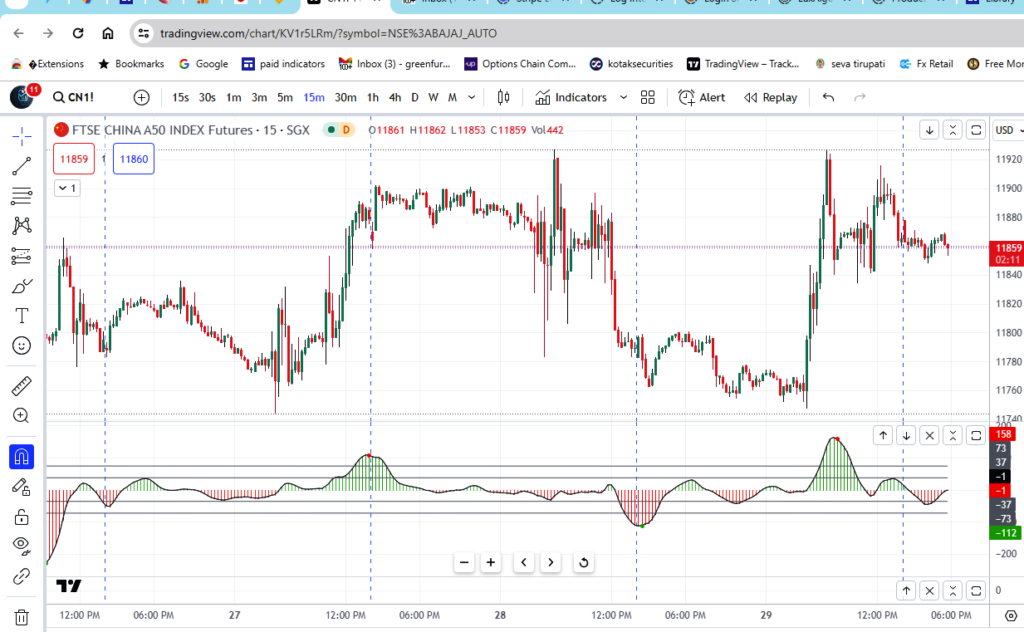
Butterfly Oscillator
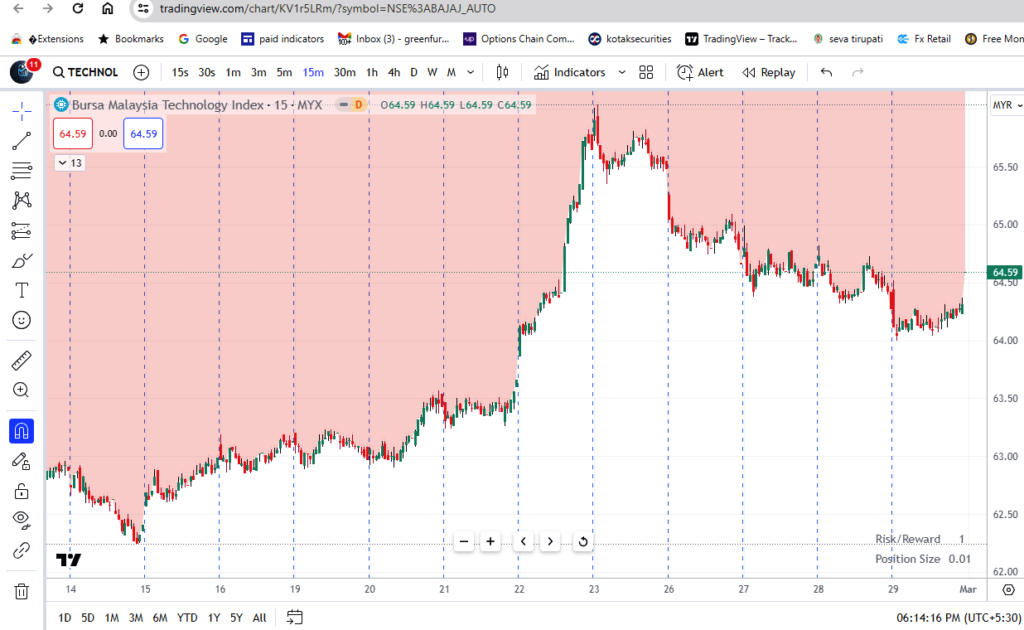
Risk Management Tool
Bart Pattern
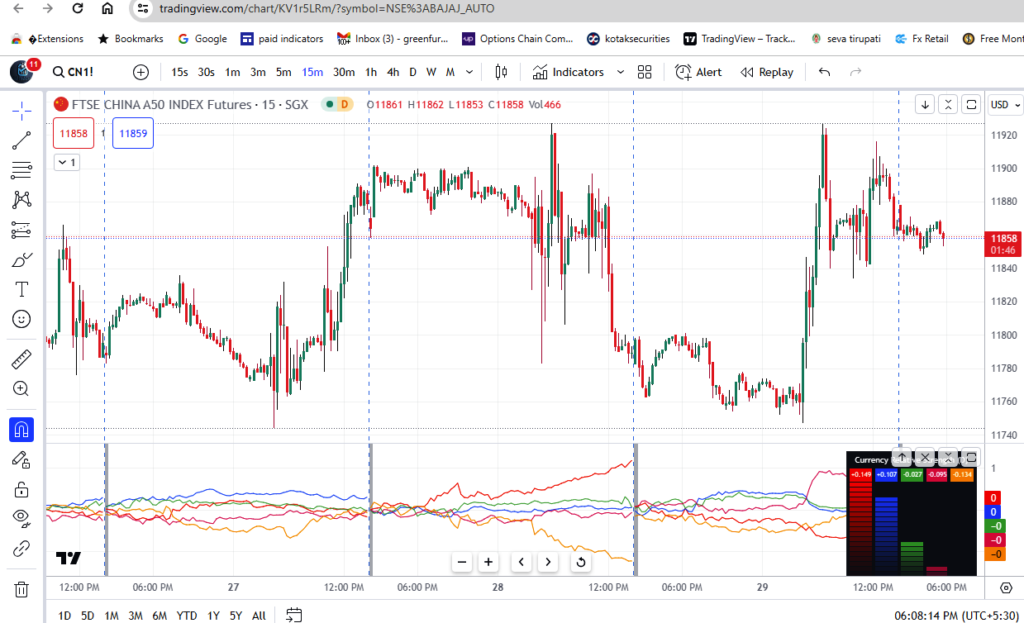
Currency Strength Index
Bolinger Band Oscilator
Previous Days, Weeks, Months High & Low
Previous Trend Extrapolated
Trend Heatmap
SMT Divergences
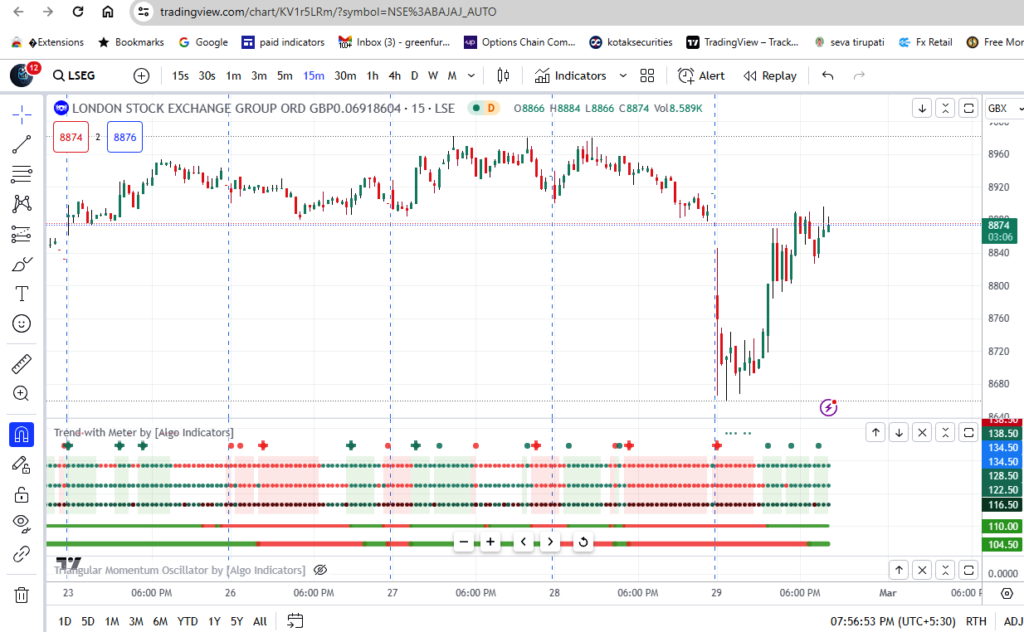
Trend Meter
Intraday Indicator
Magic SR Indicator
CPR Indicator
Algo Price Action Indicator
Magic SR Block Detector Indicator
We keep uploading new Indicators, subscribe for regular Updates